Which of the following describes the method of sampling in which elements of data are
selected randomly from each of the small subgroups within a population?
Correct Answer:
D
This is because stratified is a type of sampling in which elements of data are selected randomly from each of the small subgroups within a population, such as age groups, gender groups, or income groups. Stratified sampling can be used to ensure that the sample is representative and proportional of the population, as well as reduce the sampling error or bias. For example, stratified sampling can be used to select a sample of voters from different political parties based on their proportion in the population. The other types of sampling are not the types of sampling in which elements of data are selected randomly from each of the small subgroups within a population. Here is why:
✑ Simple random is a type of sampling in which elements of data are selected randomly from the entire population, without dividing it into any subgroups. Simple random sampling can be used to ensure that every element in the population has an equal chance of being selected, as well as avoid any systematic error or bias. For example, simple random sampling can be used to select a sample of students from a school by using a lottery or a computer-generated number.
✑ Cluster is a type of sampling in which elements of data are selected randomly from
a few large subgroups within a population, such as regions, districts, or schools. Cluster sampling can be used to reduce the cost and complexity of sampling, as well as increase the feasibility and convenience of sampling. For example, cluster sampling can be used to select a sample of households from a few neighborhoods by using a map or a list.
✑ Systematic is a type of sampling in which elements of data are selected at regular
intervals from an ordered list or sequence within a population, such as every nth element or every kth element. Systematic sampling can be used to simplify and speed up the sampling process, as well as ensure that the sample covers the entire range or scope of the population. For example, systematic sampling can be used to select a sample of books from a library by using an alphabetical order or a numerical order.
A data analyst is creating a report that will provide information about various regions, products, and time periods. Which of the following formats would be the most efficient way to deliver this report?
Correct Answer:
D
The best format to deliver this report is D. A dashboard with filters at the top that the user can toggle.
A dashboard is a visual display of the most important information needed to achieve one or more objectives, consolidated and arranged on a single screen so the information can be monitored at a glance1 A dashboard with filters at the top that the user can toggle would allow the user to easily and quickly access the information they need about various regions, products, and time periods, without having to navigate through multiple tabs, pages, or emails. A dashboard with filters would also enable the user to compare and contrast different views of the data and see how they change over time. A dashboard with filters would also be more interactive and engaging than a static or email report2
A workbook with multiple tabs for each region would not be an efficient way to deliver this report, because it would require the user to switch between different tabs to see the information they need. This would make it harder to compare and contrast different regions, products, and time periods, and also increase the risk of errors or confusion. A workbook with multiple tabs would also be less visually appealing and more cluttered than a dashboard3
A daily email with snapshots of regional summaries would not be an efficient way to deliver this report, because it would limit the user??s ability to explore the data in depth and customize their view. A daily email would also be dependent on the frequency and timing of the email delivery, which might not match the user??s needs or preferences. A daily email
would also be more likely to be ignored or deleted than a dashboard that is always accessible.
A static report with a different page for every filtered view would not be an efficient way to deliver this report, because it would create a very long and cumbersome report that would be difficult to read and understand. A static report would also not allow the user to change or update the filters as they wish, or see how the data changes over time. A static report would also be less interactive and engaging than a dashboard.
Which one of the following in NOT a common data integration tool?
Correct Answer:
A
Cross-site Scripting (XSS) is a security vulnerability usually found in websites and/or web applications that accept user input.
XSS is a client-side vulnerability that targets other application users, while SQL injection is a server-side vulnerability that targets the application's database. How do I prevent XSS in PHP? Filter your inputs with a whitelist of allowed characters and use type hints or type casting.
A data analyst has removed the outliers from a data set due to large variances. Which of the following central tendencies would be the best measure to use?
Correct Answer:
D
The median is recognized as the most appropriate measure of central tendency when outliers have been removed from a dataset. This is because the median is less influenced by extreme values compared to the mean. When outliers are present, they can significantly skew the mean, making it an unreliable measure of central tendency. The median, on the other hand, is the middle value of a dataset when ordered from least to greatest and remains unaffected by the extremes. Therefore, it provides a better representation of the
central location of the data after outliers have been excluded.
References:
✑ Guidelines for Removing and Handling Outliers in Data1.
✑ Mean, Median, and Mode: Measures of Central Tendency2.
✑ Which measure of central tendency should be used when there is an outlier?3.
✑ How are measures of central tendency affected by outliers?4.
Given the table below: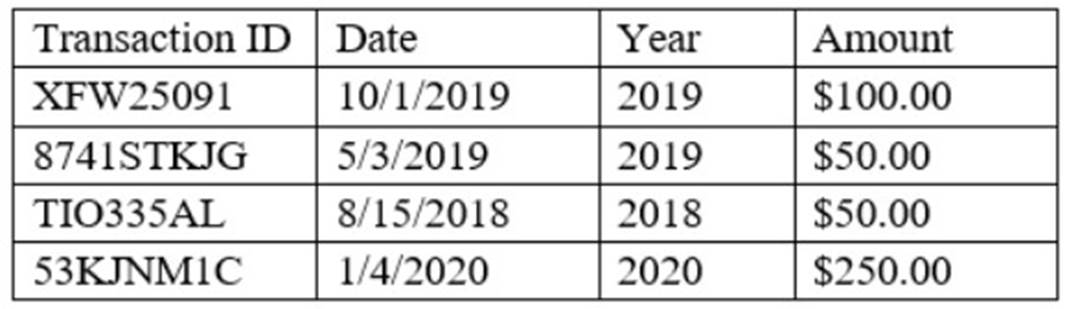
Which of the following variable types BEST describes the ??Year?? column?
Correct Answer:
B
This is because date is a type of variable that represents a specific point or period in time, such as a day, a month, or a year. Date variables can be used to store, manipulate, or analyze temporal data, such as transaction dates, birth dates, or expiration dates. For example, date variables can be used to calculate the duration or the difference between two dates, or to filter or sort the data by date. The other variable types are not correct descriptions of the ??Year?? column. Here is why:
✑ Numeric is a type of variable that represents a numerical value, such as an integer, a decimal, or a fraction. Numeric variables can be used to store, manipulate, or analyze quantitative data, such as amounts, prices, or scores. For example, numeric variables can be used to perform arithmetic operations or calculations on the data, or to measure the central tendency or the dispersion of the data.
✑ Alphanumeric is a type of variable that represents a combination of alphabetic and
numeric characters, such as letters, numbers, symbols, or spaces. Alphanumeric variables can be used to store, manipulate, or analyze textual data, such as names, addresses, or codes. For example, alphanumeric variables can be used to concatenate or split the data, or to search or match the data using patterns or expressions.
✑ Text is a type of variable that represents a sequence of alphabetic characters,
such as letters or words. Text variables can be used to store, manipulate, or analyze textual data, such as names, categories, or labels. For example, text variables can be used to change the case or the length of the data, or to compare or classify the data using criteria or rules.