A data analyst is following up on a recent, company-wide data audit of customer invoice data. Which of the following is the best option for the analyst to use?
Correct Answer:
B
This question falls under theData Governancedomain of CompTIA Data+ DA0-002, which includes understanding compliance frameworks for data audits, especially for customer data. The scenario involves a data audit of customer invoice data, which likely contains personal information, making privacy regulations relevant.
✑ PCI DSS (Option A): PCI DSS (Payment Card Industry Data Security Standard)
applies specifically to payment card data, not general customer invoice data unless credit card details are involved, which isn??t specified.
✑ GDPR (Option B): GDPR (General Data Protection Regulation) is a
comprehensive privacy regulation for handling personal data of EU citizens, including customer invoice data, which may contain PII like names and addresses. It??s the most relevant for a company-wide data audit.
✑ ISO (Option C): ISO standards (e.g., ISO 27001) relate to information security
management but are not specific to customer data privacy audits.
✑ PII (Option D): PII (Personally Identifiable Information) is a concept, not a framework or tool for conducting an audit.
The DA0-002 Data Governance domain emphasizes "identifying PII and data privacy concepts," and GDPR is the most appropriate framework for auditing customer data to ensure compliance with privacy laws.
Reference: CompTIA Data+ DA0-002 Draft Exam Objectives, Domain 5.0 Data Governance.
==============
A data breach occurs at a company. Which of the following actions should be taken?
Correct Answer:
B
This question falls under theData Governancedomain, focusing on data breach response protocols. A data breach requires a structured response to comply with legal and regulatory requirements.
✑ Make an announcement on social media so customers are aware as soon as
possible (Option A): Public announcement without internal coordination or
regulatory notificationcan lead to legal issues and loss of trust.
✑ Tell the company management team and then tell regulatory agencies (Option B): This follows best practices: inform internal leadership to coordinate a response, then notify regulatory agencies as required by laws (e.g., GDPR mandates notification within 72 hours).
✑ Keep the incident a secret until the issue is resolved (Option C): This violates regulations requiring timely breach notification.
✑ Inform the entire IT sector, but ask for discretion (Option D): Sharing with the IT sector is vague and risks leaks; regulatory agencies should be prioritized.
The DA0-002 Data Governance domain includes "data privacy concepts," such as proper breach response procedures, emphasizing internal and regulatory notification. Reference: CompTIA Data+ DA0-002 Draft Exam Objectives, Domain 5.0 Data Governance.
==============
SIMULATION
The director of operations at a power company needs data to help identify where company resources should be allocated in order to monitor activity for outages and restoration of power in the entire state. Specifically, the director wants to see the following:
* County outages
* Status
* Overall trend of outages
INSTRUCTIONS:
Please, select each visualization to fit the appropriate space on the dashboard and choose an appropriate color scheme. Once you have selected all visualizations, please, select the appropriate titles and labels, if applicable. Titles and labels may be used more than once.
If at any time you would like to bring back the initial state of the simulation, please click the Reset All button.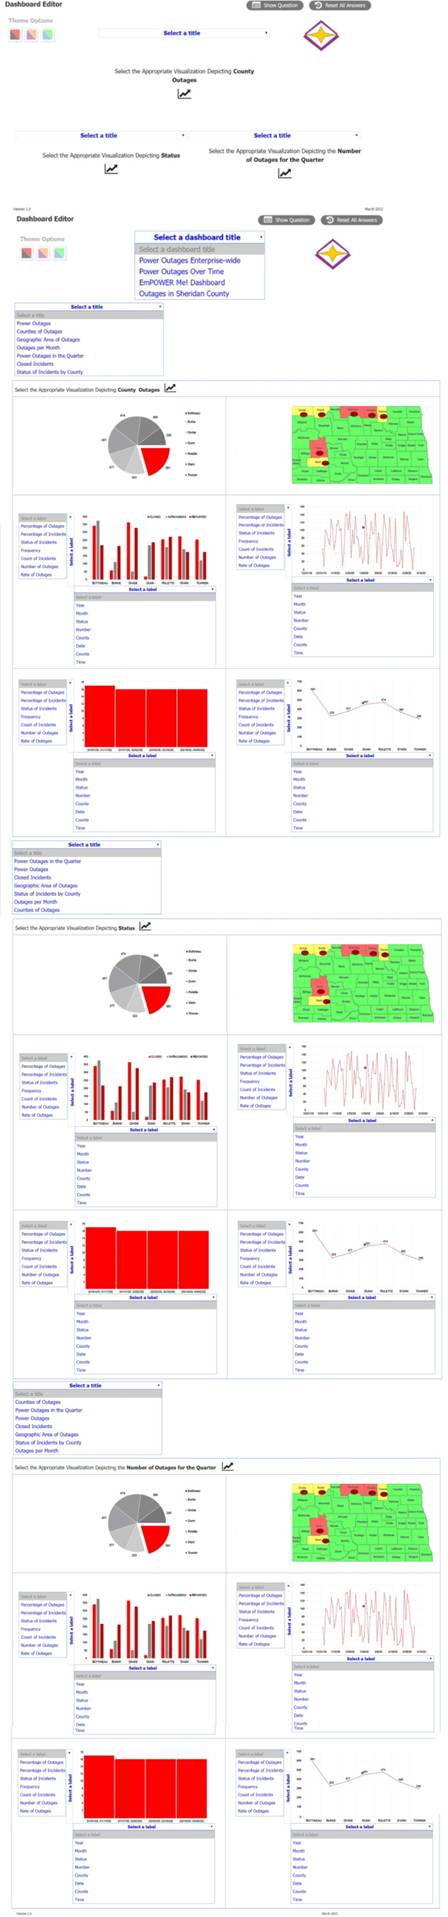
Solution:
This is a simulation question that requires you to create a dashboard with visualizations that meet the director??s needs.Here are the steps to complete the task:
✑ Drag and drop the visualization that shows the county outages on the top left
space of the dashboard. This visualization is a map of the state with different colors indicating the number of outages in each county. You can choose any color scheme that suits your preference, but make sure that the colors are consistent and clear. For example, you can use a gradient of red to show the counties with more outages and green to show the counties with less outages.
✑ Drag and drop the visualization that shows the status of the outages on the top
right space of the dashboard. This visualization is a pie chart that shows the percentage of outages that are active, restored, or pending. You can choose any color scheme that suits your preference, but make sure that the colors are distinct and easy to identify. For example, you can use red for active, green for restored, and yellow for pending.
✑ Drag and drop the visualization that shows the overall trend of outages on the
bottom space of the dashboard. This visualization is a line graph that shows the number of outages over time. You can choose any color scheme that suits your preference, but make sure that the color is visible and contrasted with the background. For example, you can use blue for the line and white for the background.
✑ Select appropriate titles and labels for each visualization. Titles and labels may be
used more than once. For example, you can use ??County Outages?? as the title for the map, ??Status?? as the title for the pie chart, and ??Trend?? as the title for the line graph. You can also use ??County??, ??Number of Outages??, ??Active??, ??Restored??, ??Pending??, ??Time??, and ??Number of Outages?? as labels for the axes and legends of the visualizations.
Does this meet the goal?
Correct Answer:
A
A data analyst needs to create a report that anticipates the number of calls received daily. Which of the following is the best statistical method to use?
Correct Answer:
A
This question falls under theData Analysisdomain, focusing on statistical methods for forecasting. The task is to anticipate (predict) the number of daily calls, which involves looking into the future.
✑ Predictive (Option A): Predictive analytics uses historical data to forecast future
outcomes (e.g., number of calls), which matches the requirement.
✑ Diagnostic (Option B): Diagnostic analytics identifies causes and patterns in historical data, not future predictions.
✑ Inferential (Option C): Inferential statistics make generalizations about a population, not specific forecasts.
✑ Descriptive (Option D): Descriptive analytics summarizes past data, not suitable for anticipating future values.
The DA0-002 Data Analysis domain includes "applying the appropriate descriptive statistical methods," and predictive analytics is the best method for forecasting future call volumes.
Reference: CompTIA Data+ DA0-002 Draft Exam Objectives, Domain 3.0 Data Analysis.
==============
Given the following dataset:
Day
Number of Guests
Monday 455
Tuesday 346
Wednesday 382
Thursday 563
Friday 887
Saturday 934
Sunday 346
Which of the following is the mode?
Correct Answer:
A
This question falls under theData Analysisdomain, focusing on statistical measures. The mode is the value that appears most frequently in a dataset.
✑ Monday: 455
✑ Tuesday: 346
✑ Wednesday: 382
✑ Thursday: 563
✑ Friday: 887
✑ Saturday: 934
✑ Sunday: 346
The value 346 appears twice (Tuesday and Sunday), while all other values (455, 382, 563, 887, 934) appear once. Thus, the mode is 346.
✑ Option A: 346– Correct, as it??s the most frequent value.
✑ Option B: 446– Incorrect, as 446 doesn??t appear in the dataset.
✑ Option C: 455– Incorrect, as 455 appears only once.
✑ Option D: 559– Incorrect, as 559 doesn??t appear in the dataset.
The DA0-002 Data Analysis domain includes "applying the appropriate descriptive statistical methods," and the mode is a fundamental measure of central tendency. Reference: CompTIA Data+ DA0-002 Draft Exam Objectives, Domain 3.0 Data Analysis.
==============