Exhibit.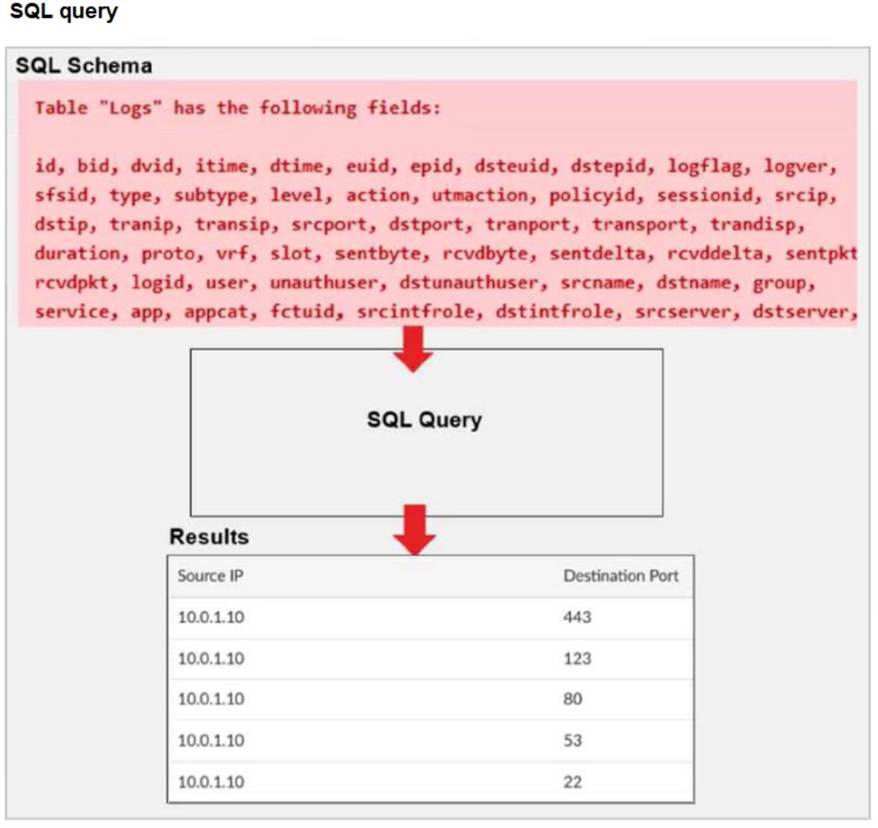
A fortiAnalyzer analyst is customizing a SQL query to use in a report.
Which SQL query should the analyst run to get the expected results?
A)SELECT srcip AS "Source IP", dstport AS "Destination Port" FROM $log - WHERE $filter AND srcip = '10.0.1.10' GROUP BY srcip, dstport - ORDER BY dstport DESC
B)SELECT srcip AS "Source IP", dstport AS "Destination Port" FROM $log - WHERE $filter AND Source IP != '10.0.1.10' GROUP BY srcip, dstport - ORDER BY dstport DESC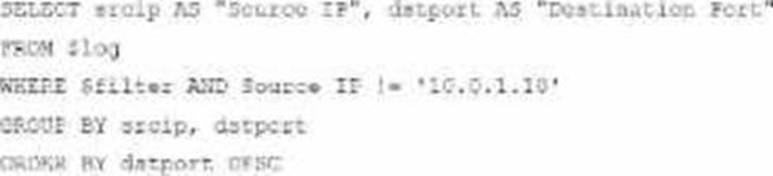
C)SELECT srcip AS "Source IP", dstport AS "Destination Port" ORDER BY dstport DESC - GROUP BY srcip, dstport - FROM $log - WHERE $filter AND srcip = '10.0.1.10'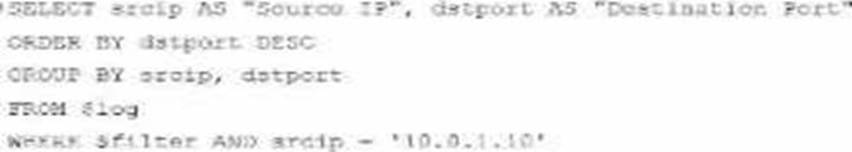
D)SELECT srcip AS "Source IP", dstport AS "Destination Port" FROM $log - WHERE $filter AND srcip = '10.0.1.10' ORDER BY dstport - GROUP by srcip, dstport DESC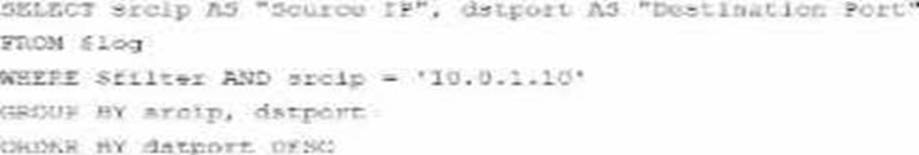
Correct Answer:
A
The requirement here is to construct a SQL query that retrieves logs with specific fields, namely "Source IP" and "Destination Port," for entries where the source IP address matches 10.0.1.10. The correct syntax is essential forselecting, filtering, ordering, and grouping the results as shown in the expected outcome.
Analysis of the Options:
Option A Explanation:
SELECT srcip AS "Source IP", dstport AS "Destination Port": This syntax selects srcip and dstport, renaming them to "Source IP" and "Destination Port" respectively in the output.
FROM $log: Specifies the log table as the data source.
WHERE $filter AND srcip = '10.0.1.10': This line filters logs to only include entries with srcip equal to 10.0.1.10.
ORDER BY dstportDESC: Orders the results in descending order by dstport.
GROUP BY srcip, dstport: Groups results by srcip and dstport, which is valid SQL syntax.
This option meets all the requirements to get the expected results accurately.
Option B Explanation:
WHERE $filter AND Source IP != '10.0.1.10': Uses != instead of =. This would exclude logs from the specified IP 10.0.1.10, which is contrary to the expected result.
Option C Explanation:
The ORDER BY clause appears before the FROM clause, which is incorrect syntax. SQL requires the FROM clause to follow the SELECT clause directly.
Option D Explanation:
The GROUP BY clause should follow the FROM clause. However, here, it??s located after WHERE, making it syntactically incorrect.
Conclusion:
Correct Answer A. Option A
This option aligns perfectly with standard SQL syntax and filters correctly for srcip = '10.0.1.10', while ordering and grouping as required.
[References:, FortiAnalyzer 7.4.1 SQL query capabilities and syntax for report customization., ]
Exhibit.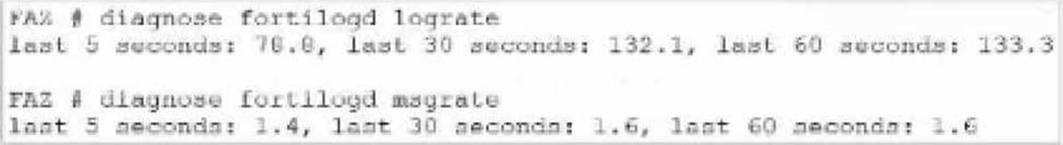
What can you conclude about the output?
Correct Answer:
A
In this output, we see two diagnostic commands executed on a FortiAnalyzer device:
diagnose fortilogd lograte: This command shows the rate at which logs are being processed by the FortiAnalyzer in terms of log entries per second.
diagnose fortilogd msgrate: This command displays the message rate, or the rate at which individual messages are being processed.
The values provided in the exhibit output show:
Log rate (lograte): Consistently high, showing values such as 70.0, 132.1, and 133.3 logs per second over different time intervals.
Message rate (msgrate): Lower values, around 1.4 to 1.6 messages per second. Explanation
Interpretation of log rate vs. message rate: In FortiAnalyzer, the log rate typically refers to the rate of logs being stored or indexed, while the message rate refers to individual messages within these logs. Given that a single log entry can contain multiple messages, it's common to see a lower message rate relative to the log rate.
Understanding normal operation: In this case, the message rate being lower than the log rate is expected and typical behavior. This discrepancy can arise because each log entry may bundle multiple related messages, reducing the message rate relative to the log rate.
Conclusion
Correct Answer A. The message rate being lower than the log rate is normal.
This aligns with thenormal operational behavior of FortiAnalyzer in processing logs and messages.
There is no indication that both logs and messages are nearly finished indexing, as that would typically show diminishing rates toward zero, which is not the case here. Additionally, there's no information in this output about specific ADOMs or a comparison between traffic logs and event logs. Thus, options B, C, and D are incorrect.
[References:, FortiOS 7.4.1 and FortiAnalyzer 7.4.1 command guides for diagnose fortilogd lograte and diagnose fortilogd msgrate., ]
Which two actions should an administrator take to vide Compromised Hosts on FortiAnalyzer? (Choose two.)
Correct Answer:
AB
To view Compromised Hosts on FortiAnalyzer, certain configurations need to be in place on both FortiGate and FortiAnalyzer. Compromised Host data on FortiAnalyzer relies on log information from FortiGate to analyze threats and compromised activities effectively.
Here's why the selected answers are correct:
Option A: Enable device detection on the FortiGate devices that are sending logs to FortiAnalyzer
Enabling device detection on FortiGate allows it to recognize and log devices within the network, sending critical information about hosts that could be compromised. This is essential because FortiAnalyzer relies on these logs to determine which hosts may be at risk based on suspicious activities observed by FortiGate. This setting enables FortiGate to provide device-level insights, which FortiAnalyzer uses to populate the Compromised Hosts view.
Option B: Enable web filtering in firewall policies on FortiGate devices, and make sure these logs are sent to FortiAnalyzer Web filtering is crucial in identifying potentially compromised hosts since it logs any access to malicious sites or blocked categories. FortiAnalyzer uses these web filter logs to detect suspicious or malicious web activity, which can indicate compromised hosts. By ensuring that FortiGate sends these web filtering logs to FortiAnalyzer, the administrator enables FortiAnalyzer to analyze and identify hosts engaging in risky behavior.
Let's review the other options for clarity:
Option C: Make sure all endpoints are reachable by FortiAnalyzer
This is incorrect. FortiAnalyzer does not need direct access to all endpoints. Instead, it collects data indirectly from FortiGate logs. FortiGate devices are the ones that interact with endpoints and then forward relevant logs to FortiAnalyzer for analysis.
Option D: Subscribe FortiAnalyzer to FortiGuard to keep its local threat database up to date
Although subscribing to FortiGuard helps keep threat intelligence updated, it is not a requirement specifically to view compromised hosts. FortiAnalyzer primarily uses logs from FortiGate (such as web filtering and device detection) to detect compromised hosts.
Reference: According to FortiOS and FortiAnalyzer documentation, device detection on FortiGate and enabling web filtering logs are both recommended steps for populating the Compromised Hosts view on FortiAnalyzer. These logs provide insights into device behaviors and web activity, which are essential for identifying and tracking potentially compromised hosts.
Exhibit.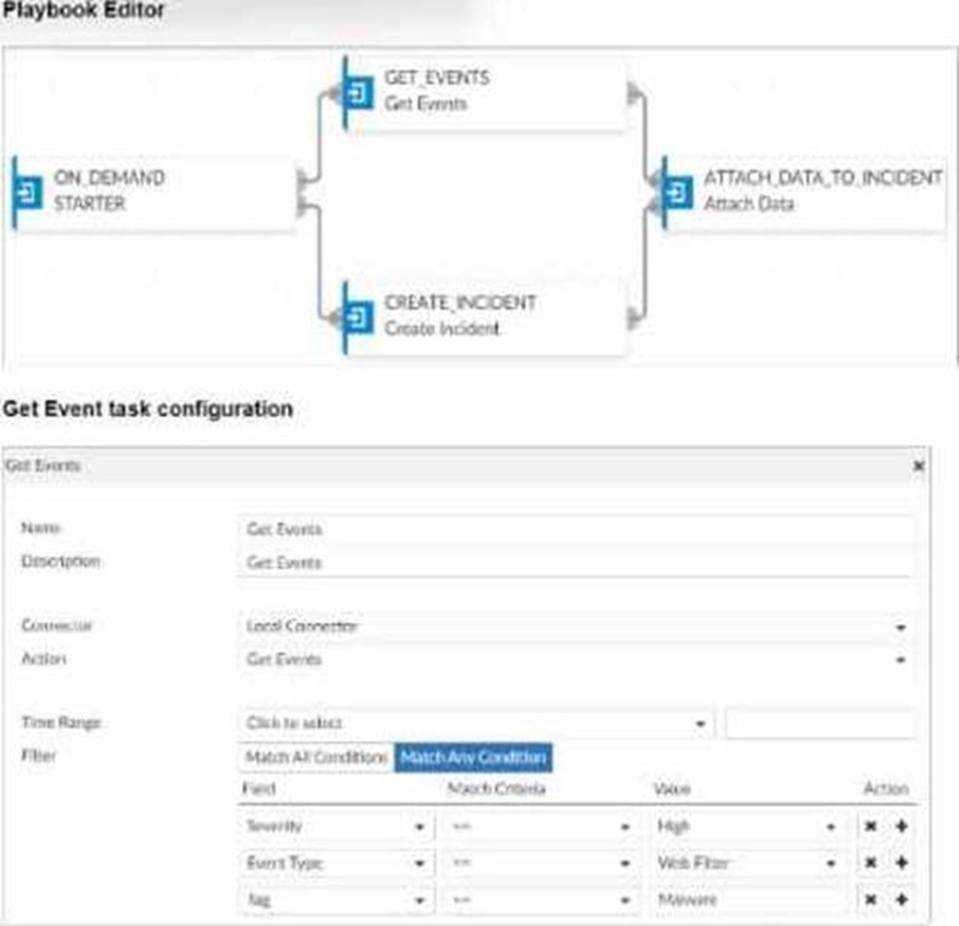
Assume these are all the events that exist on the FortiAnalyzer device.
How many events will be added to the incident created after running this playbook?
Correct Answer:
D
In the exhibit, we see a playbook in FortiAnalyzer designed to retrieve events based on specific criteria, create an incident, and attach relevant data to that incident. The "Get Event" task configuration specifies filters to match any of the following conditions:
Severity= High
Event Type= Web Filter
Tag= Malware
Analysis of Events:
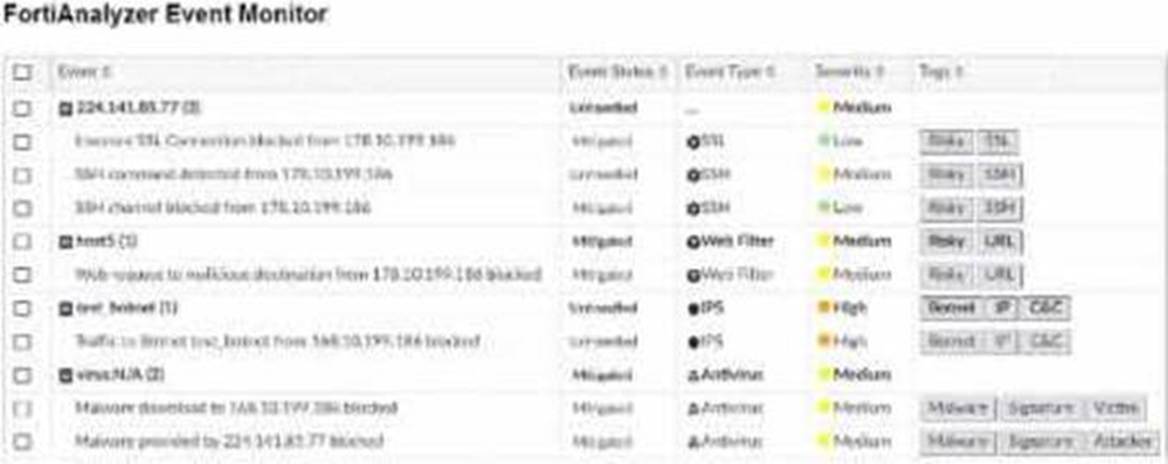
In the FortiAnalyzer Event Monitor list:
We need to identify events that meet any one of the specified conditions (since the filter is set to "Match Any Condition").
Events Matching Criteria:
Severity = High:
There are two events with "High" severity, both with the "Event Type" IPS.
Event Type = Web Filter:
There are two events with the "Event Type" Web Filter. One has a "Medium" severity, and the other has a "Low" severity.
Tag = Malware:
There are two events tagged with "Malware," both with the "Event Type" Antivirus and "Medium" severity.
After filtering based on these criteria, there arefour distinct events:
Two from the "Severity = High" filter.
One from the "Event Type = Web Filter" filter.
One from the "Tag = Malware" filter.
Conclusion:
Correct Answer:D. Four events will be added.
This answer matches the conditions set in the playbook filter configuration and the events listed in the Event Monitor.
[References:, FortiAnalyzer 7.4.1 documentation on event filtering, playbook configuration, and incident management criteria., ]
Which log will generate an event with the status Unhandled?
Correct Answer:
B
In FortiOS 7.4.1 and FortiAnalyzer 7.4.1, the "Unhandled" status in logs typically signifies that the FortiGate encountered a security event but did not take any specific action to block or alter it. This usually occurs in the context of Intrusion Prevention System (IPS) logs.
IPS logs with action=pass: When the IPS engine inspects traffic and determines that it does not match any known attack signatures or violate any configured policies, it assigns the action "pass". Since no action is taken to block or modify this traffic, the status is logged as "Unhandled."
Let's look at why the other options are incorrect:
An AV log with action=quarantine: Antivirus (AV) logs with the action "quarantine" indicate that a file was detected as malicious and moved to quarantine. This is a definitive action, so the status wouldn't be "Unhandled."
A WebFilter log will action=dropped: WebFilter logs with the action "dropped" indicate that web traffic was blocked according to the configured web filtering policies. Again, this is a specific action taken, not an "Unhandled" event.
An AppControl log with action=blocked: Application Control logs with the action "blocked" mean that an application was denied access based on the defined application control rules. This is also a clear action, not "Unhandled."