Given the following customer and order tables:
Which of the following describes the number of rows and columns of data that would be present after performing an INNER JOIN of the tables?
Correct Answer:
B
This is because an INNER JOIN is a type of join that combines two tables based on a matching condition and returns only the rows that satisfy the condition. An
INNER JOIN can be used to merge data from different tables that have a common column or a key, such as customer ID or order ID. To perform an INNER JOIN of the customer and order tables, we can use the following SQL statement:
This statement will select all the columns (*) from both tables and join them on the customer ID column, which is the common column between them. The result of this statement will be a new table that has seven rows and eight columns, as shown below: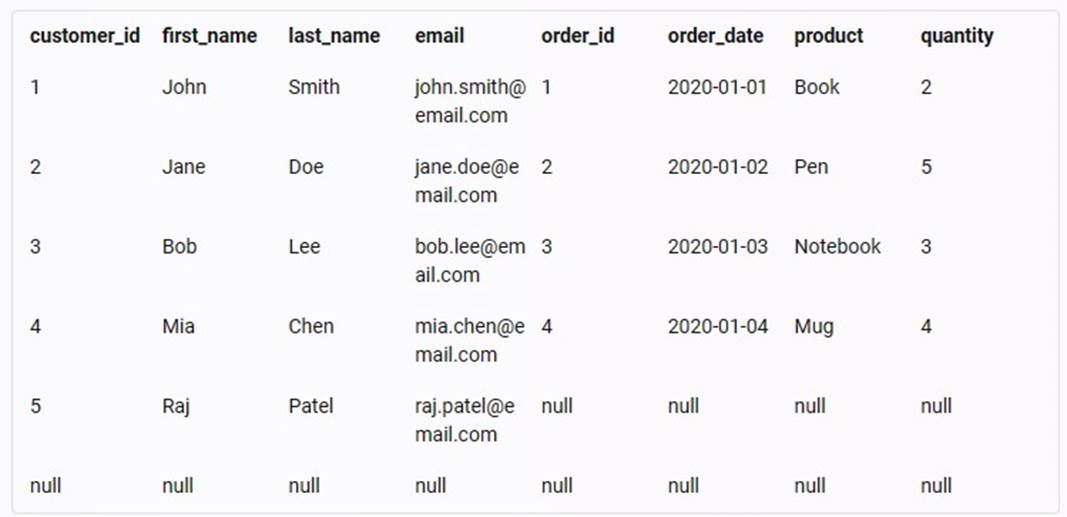
The reason why there are seven rows and eight columns in the result table is because:
✑ There are seven rows because there are six customers and six orders in the original tables, but only five customers have matching orders based on the customer ID column. Therefore, only five rows will have data from both tables, while one row will have data only from the customer table (customer 5), and one row will have no data at all (null values).
✑ There are eight columns because there are four columns in each of the original tables, and all of them are selected and joined in the result table. Therefore, the result table will have four columns from the customer table (customer ID, first name, last name, and email) and four columns from the order table (order ID, order date, product, and quantity).
You should always choose the analytics tool that is most appropriate for any given situation, even if that means acquiring a new tool.
Correct Answer:
B
The statement is false. You should not always choose the analytics tool that is most appropriate for any given situation, even if that means acquiring a new tool. Acquiring a new tool can be costly, time-consuming, and risky, as it may not be compatible with your existing data sources, systems, or processes. It may also require additional training, maintenance, and support. Therefore, you should always consider the trade-offs between the benefits and drawbacks of acquiring a new tool versus using an existing one. You should also evaluate the feasibility, availability, and reliability of the new tool before making a decision. Reference: CompTIA Data+ (DA0-001) Practice Certification Exams | Udemy
An analyst needs to provide a chart to identify the composition between the categories of the survey response data set: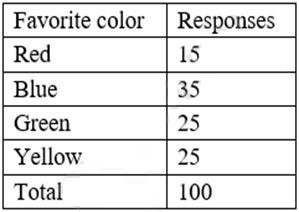
Which of the following charts would be BEST to use?
Correct Answer:
B
The best chart to use to identify the composition between the categories of the survey response data set is a pie chart. A pie chart is a circular chart that shows the relative proportions of different categories in a whole. A pie chart is divided into slices that represent the percentage or frequency of each category. A pie chart is suitable for displaying categorical data that has a few categories and does not have any hierarchical or temporal relationship. In this case, a pie chart can show the composition of the favorite colors among the survey respondents, as well as the percentage of each color. The other options are not as good as a pie chart for this purpose, as they are more suitable for displaying numerical data that has some kind of distribution, trend, correlation, or comparison. A histogram is a bar chart that shows the frequency distribution of a single numerical variable. A line chart is a chart that shows the change of one or more numerical variables over time or another continuous variable. A scatter plot is a chart that shows the relationship between two numerical variables by plotting them as points on a Cartesian plane. A waterfall chart is a chart that shows how an initial value is increased or decreased by a series of intermediate values, resulting in a final value. Reference: [Choosing the Right Chart Type - DataCamp]
Which of following is a non-relational database?
Correct Answer:
A
Neo4j is a type of non-relational database that uses a graph model to store data. A graph database is a database that represents data as nodes and edges, where nodes are entities and edges are relationships between them. A graph database can store complex and diverse data that is not easily structured in tables. A graph database can also perform fast and efficient queries on the data by traversing the connections between the nodes
You have two databases tables that you would like to join together using a foreign key relationship.
What term best describes this action?
Correct Answer:
D
Data merging is the process of combining two or more data sets into a single data set. Most often, this process is necessary when you have raw data stored in multiple files, worksheets, or data tables, that you want to analyze all in one go.