You need to access options to change a dimension's color palette. In addition to the Marks card, what else can you use?
Correct Answer:
A
You can use the Color legend to access options to change a dimension’s color palette, in addition to the Marks card. The Color legend shows the colors assigned to each member of the dimension in the view. You can right-click on the Color legend and select Edit Colors to open the Edit Colors dialog box, where you can change the color palette, assign specific colors to dimension members, or edit the color transparency and border6 The other options are not valid ways to change a dimension’s color palette. Edit in Shelf is a feature that allows you to edit the fields on the Rows or Columns shelves by typing directly on the shelf. It does not affect the color palette of the dimension7 The Format menu allows you to change the appearance of various elements in the workbook, such as fonts, borders, shading, alignment, etc. It does not have options for changing the color palette of the dimension8 Edit Caption is a feature that allows you to add or edit a caption for a worksheet or dashboard. It does not affect the color palette of the dimension
Which of the following situations describe the best reason to use a union?
Correct Answer:
A
You should use a union when you have two tables with similarly named columns of data that you want to combine. A union is a method for combining data by appending rows of one table onto another table. The tables that you union must have the same number of fields, the same field names, and the same data types2
Which of the following are valid ways to show Mark Labels in the visualisation?
Correct Answer:
ABD
The following showcase how you can show mark labels. Using the Sample Superstore dataset:
1) Let's create a Bar chart showing the sales for each sub-category: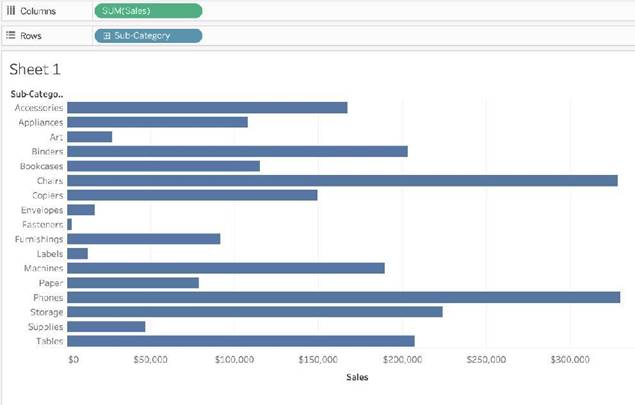
2) Now you can show labels by:
* 2.1) Click on Show Mark Labels Icon in the Toolbar ( easiest )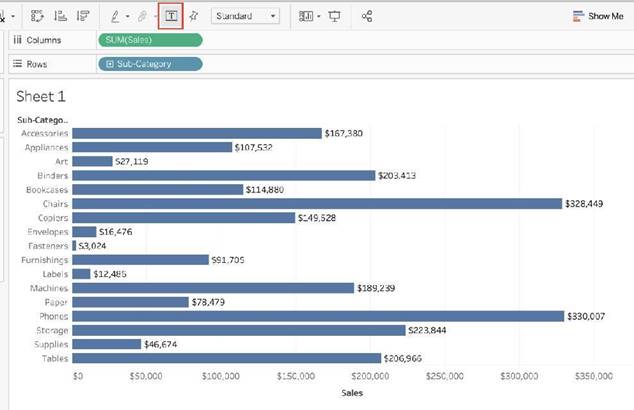
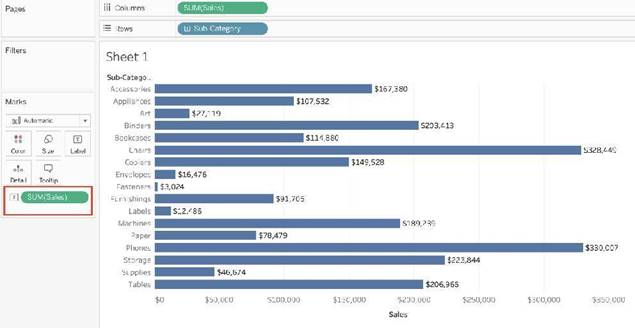
* 2.2) Drag Sales to the Text icon in the Marks Card:
* 2.3) Click on Analysis -> Show mark labels from the Tableau menu bar:
True or False: Context Filters are executed after Data Source filters
Correct Answer:
A
THIS IS A VERY IMPORTANT QUESTION
To answer this question, you need to understand Tableau's Order of Operations. See below and remember this always: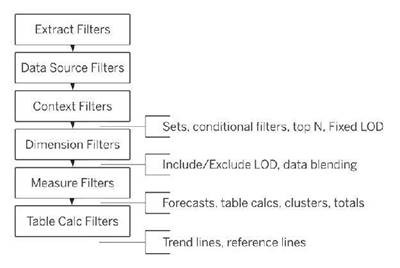
Reference: https://help.tableau.com/current/pro/desktop/en-us/order_of_operations.htm
Which of the following is NOT a valid official data source in Tableau Desktop?
Correct Answer:
C
Presently, there is no official way to connect your data inFirebase directly withTableau Desktop.
A workaround however can be to export your Firebase data into Google BigQuery, and then connect it to Tableau Desktop.
But then again, it is a workaround and not an official out-of-the-box solution. The following are the available Data sources available as of now:
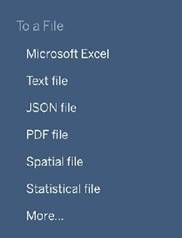
1) Server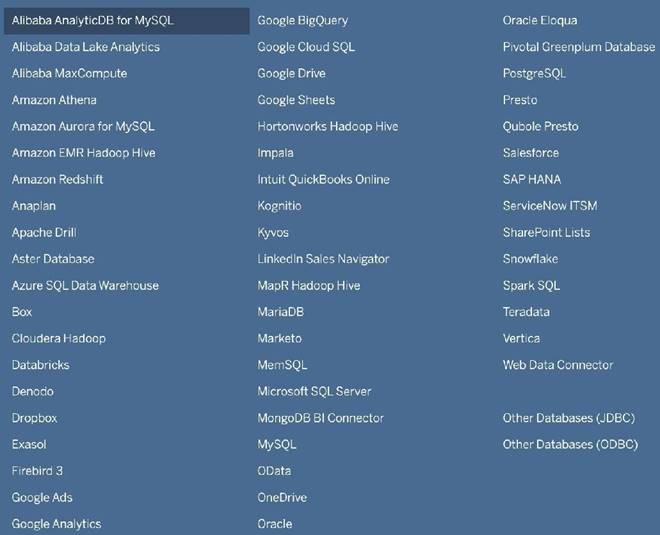
2) File