Which of the following points are True about Viz Animations?
Correct Answer:
ABD
All of the given options are true except - Animations work well with maps, polygons, and density marks in web browsers.
From the official documentation: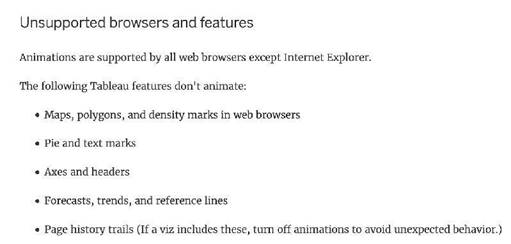
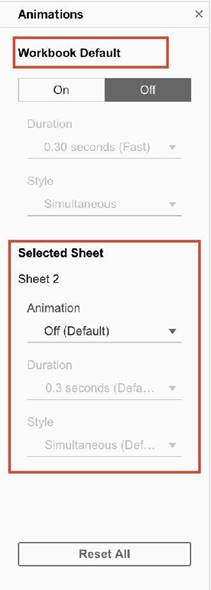
As seen above, we can either turn the animations for the entire workbook (upper red box), or only for the current sheet ( lower red box )
1) Simultaneous animations
The default simultaneous animations are faster and work well when showing value changes in simpler charts and dashboards.
2) Sequential animations
Sequential animations take more time but make complex changes clearer by presenting them step-by-step.
Reference: https://help.tableau.com/current/pro/desktop/en-us/formatting_animations.htm
Which three statements accurately describes the capabilities of dashboard actions? Choose three.
Correct Answer:
BCE
Dashboard actions in Tableau are interactive elements that can be used to create a more dynamic experience. These actions can be set to filter data on the dashboard, highlight specific elements, or even direct the user to a URL when interacting with a visualization. They can be triggered by user interaction such as hover, selection, or accessing a context menu. Moreover, dashboard actions can have multiple source sheets (where the action originates) and target sheets (where the action takes effect), allowing for a complex interactivity between different parts of the dashboard.
You have the following visualization.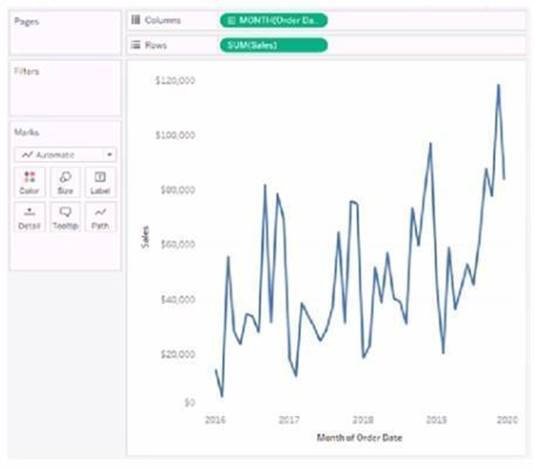
Where should you place a field named Region to show multiple distinct lines on the same axis?
Correct Answer:
B
To display multiple distinct lines on the same axis based on a field, you should place the field on the Color shelf in the Marks card. This will encode each distinct value in the Region field with a different color, resulting in separate lines for each region on the same axis.
Which statement accurately describes aliases?
Correct Answer:
D
You can assign an alias to a field member before creating a visualization. An alias is an alternative name that you can assign to a value in a dimension field. You can use aliases to rename specific values within a dimension to make them more relevant or descriptive in your view than what the original data provides. For example, you can use aliases to shorten long names, correct spelling errors, or replace codes with meaningful labels6 You can create aliases for the members of discrete dimensions only. They cannot be created for continuous dimensions, dates, or measures. To create an alias for a dimension member, you can right-click the dimension in the Data pane and select Aliases, then enter a new name for each member under Value (Alias). You can also create an alias by right-clicking a dimension member in the view and selecting Edit Alias. You can do this before or after creating a visualization6 The other options are not accurate statements about aliases. You cannot create an alias for a discrete measure, because measures are not discrete fields. You cannot create an alias for a continuous dimension, because aliases are only available for discrete dimensions. When you assign an alias, the name does not change in the database, only in Tableau. Aliases are stored as part of the workbook or data source, and do not affect the original data6
What are two examples of a date value? Choose two.
Correct Answer:
AD
Date values in Tableau represent specific points in time and are typically formatted in a standard date format.
✑ Option A, "2020-05-01", is a standard date format representing the 1st of May, 2020.
✑ Option D, "January 1, 1995", is another example of a date value, representing the 1st of January, 1995. Options B ("December") and C ("Wednesday") represent a month and a day of the week, respectively, but do not specify a particular date.