Which of the following are valid way(s) to make either of Rows or Columns Bold without affecting the other?
Correct Answer:
AD
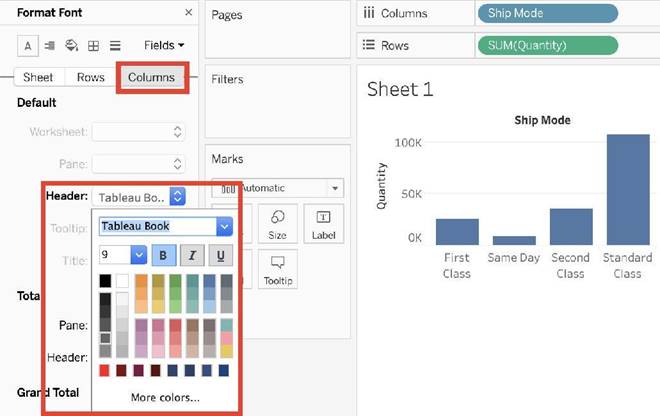
1) Right click on Rows or Columns, and choose format. In the Font option click on Bold. (CORRECT) - this will modify only the selected axis (row or column)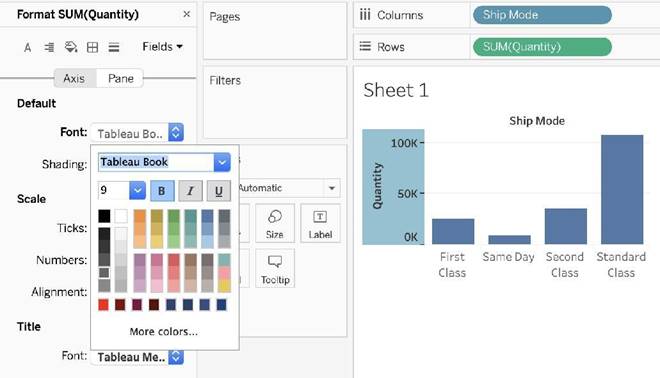
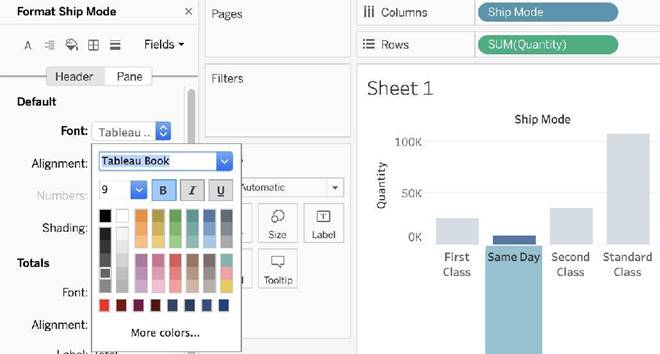
2) Choose Format then Font from the Menu bar, and select Bold under the Header option (INCORRECT) - this modifies both rows and columns at the same time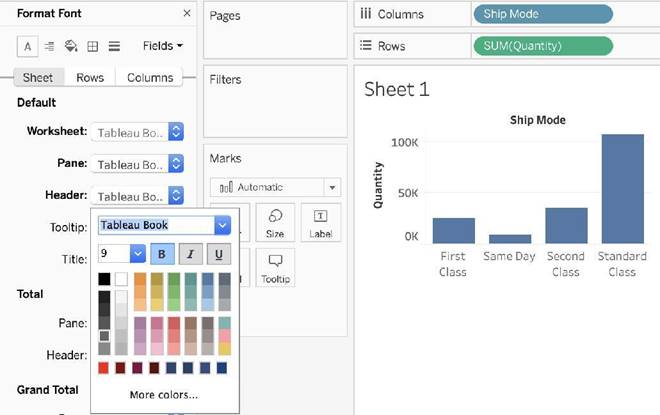
3) Choose Format from the Menu bar, select Row or Column, and then select Bold under the header option (CORRECT) - this will modify only the selected axis (row or column)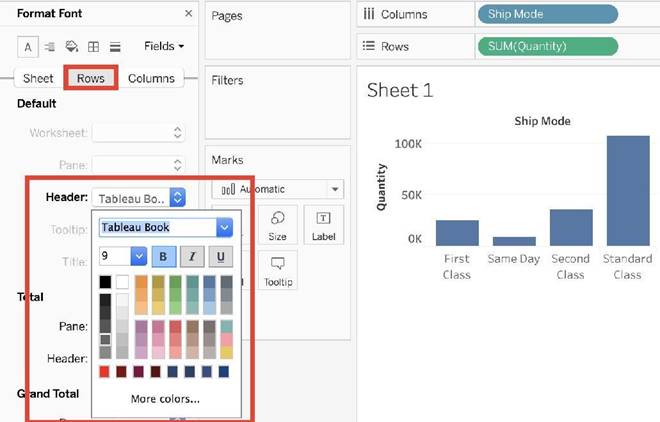
4) Select Text Label on the Marks Card, choose Rows or Columns, and then select Bold. (INCORRECT) - no such option exists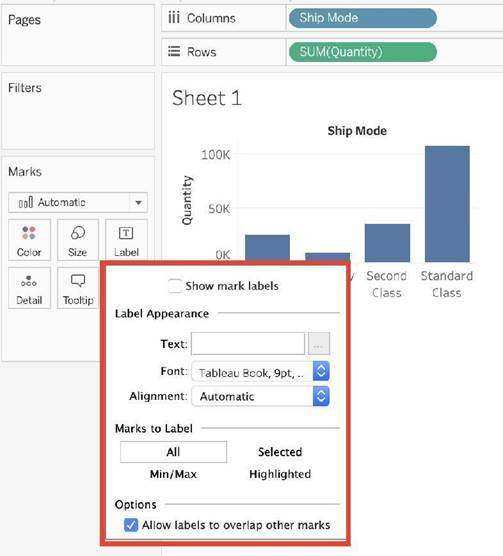
True or False: The Highlighting action can be disabled for the entire workbook.
Correct Answer:
A
Yes, it is possible to disable highlighting for the entire workbook.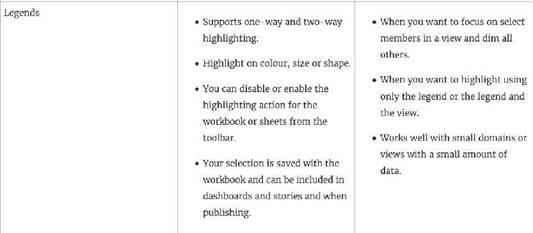
For more information : https://help.tableau.com/current/pro/desktop/en- gb/actions_highlight.htm
When creating a dashboard for multiple devices, which of the following Device options are available in the Device Preview section?
Correct Answer:
C
The following options are available in the Device preview section when creating a Dashboard: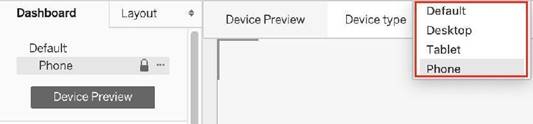
Reference: https://help.tableau.com/current/pro/desktop/en-us/dashboards_dsd_create.htm
What is created by a calculated field that has a formula of SUM(Sales)/SUM(Profit)?
Correct Answer:
B
a calculated field that has a formula of SUM(Sales)/SUM(Profit) is a measure, because it returns a numeric value that can be aggregated and used for analysis. A parameter is a user-defined variable that can be used in calculations or filters. A dimension is a categorical field that can be used to group or slice data. A set is a subset of data based on some condition.
Which of the following is a discrete date part?
Correct Answer:
D
February is a discrete date part, because it is a specific value that can be used to group or filter data by month. 07Mar2017, 20Sep2016:9:8:8:6546, and 01/23/2021 are continuous date values, because they represent points along a continuous timeline that can be used for analysis.