Suppose I have the following view. What will be the total number of marks if I drag a new measure to the row shelf vs the column shelf?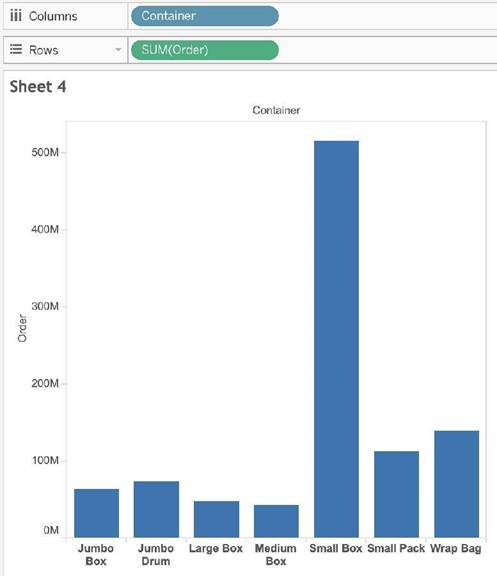
Correct Answer:
A
This is a tricky question often asked in the exam.
If we drag a new measure to the row shelf, the following happens:
We now have 2 rows, and the same 7 columns for both these rows. Therefore, 2x7 = 14 marks!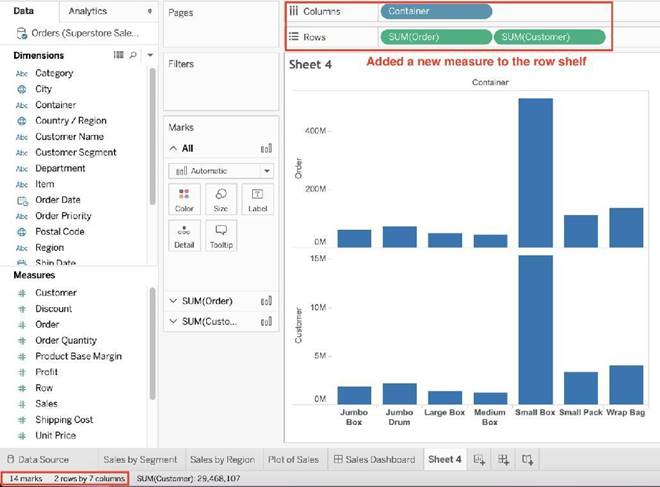
But if we drag the same measure to the column shelf, we have just 1 row and a chart created for each of the columns. So (1x7) = 7 marks!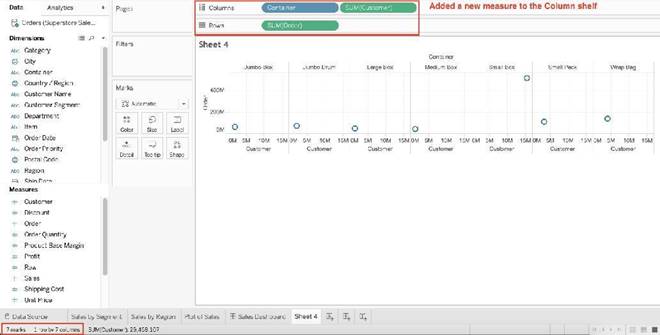
Reference and notes: https://medium.com/@justindixon91/tableau-specialist-exam-notes- part-4-understanding-tableau-concepts-f78de83fdd35
Using the dataset, create a bar chart showing the average Quantity broken down by Region, and filtered by Country to only show Japan. What was the average Quantity in the State of Tokyo?
Correct Answer:
C
Since we need to focus on 1 country -> Japan, let's filter on it first as follows:
1) Drag Country to the filter shelf, and choose only Japan. Click OK.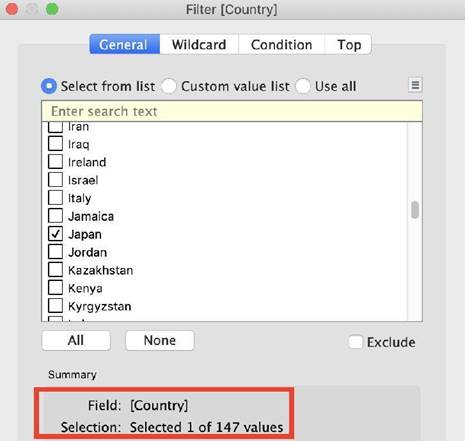
2) Read the Question Carefully, we need to break down the visualisation by Region, then by Country, and then by State. So let's do that:
Drag Region to the column shelf, followed by Country. Drill down into Country to include states as well.
Then drag Quantity to the Row Shelf, and change the Aggregation to AVERAGE. The following is our visualisation: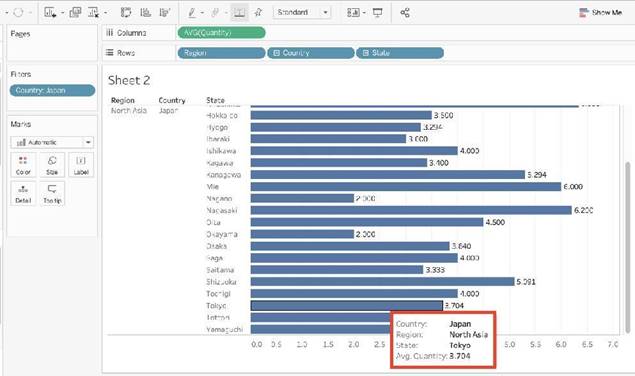
Now that you think of it, EVEN IF YOU REMOVE THE REGION, THE ANSWER REMAINS
THE SAME. Such elements will be present in the actual exam too, just to make the question sound a little difficult, but actually it is pretty straightforward :)
If you see the following Filter, then you're working with________
Larger image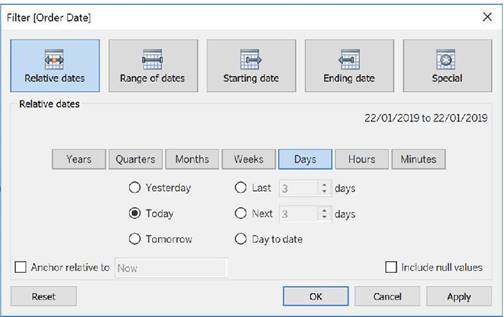
Correct Answer:
D
Dates in Tableau will behave differently depending on whether they are a Datepart (blue) or a Datevalue (green). This affects how the axes display/behave and also how visualisations such as line charts will display. The difference essentially boils down to Dateparts behaving like a dimension as opposed to a measure which is how Datevalues behave. This means that Dateparts behave like discrete categories on the view whereas Datevalues are more like continuous numeric values.
Dateparts are discrete and they behave the same as dimension filters. If all dates are used on the filter then each individual date will be a datepart that can be selected/excluded. This is the same for each level of date, if datepart months is placed on filters January to December will be tick-able options in the filter. This also means that conditions and top/bottom filters can be applied to datepart filters like any other dimension filter. Datevalues placed on filters behave like measure filters. A min and a max date can be set and there is a relative dates option which allows you to choose things like only show the previous 3 months or years etc.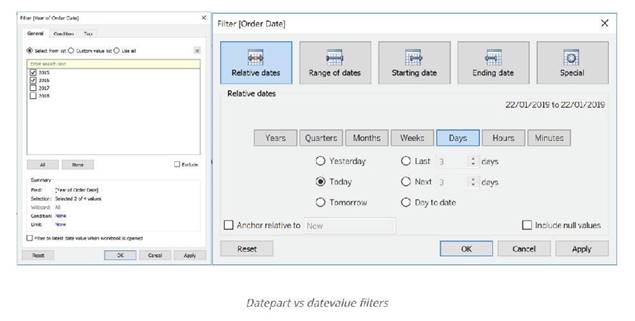
Reference: https://www.thedataschool.co.uk/harry-cooney/tableau-dateparts-vs- datevalues/
The View Data window displays as much of the data as possible by default, up to _____ rows.
Correct Answer:
C
The View Data window displays as much of the data as possible by default, up to 10,000 rows. This can be increased though, if you wish to.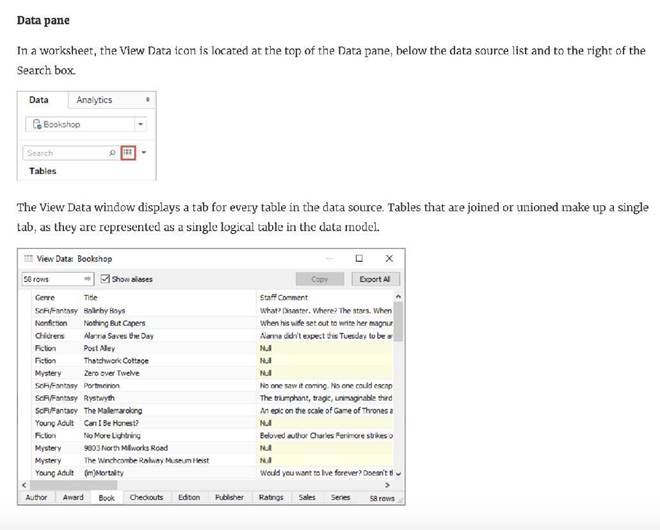
Read more: https://help.tableau.com/current/pro/desktop/en-gb/inspectdata_viewdata.htm
Is it possible to use measures in the same view multiple times (e.g. SUM of the measure and AVG of the measure)?
Correct Answer:
A
Yes, it is very much possible to use measures in the same view multiple times. For example, refer to the image below: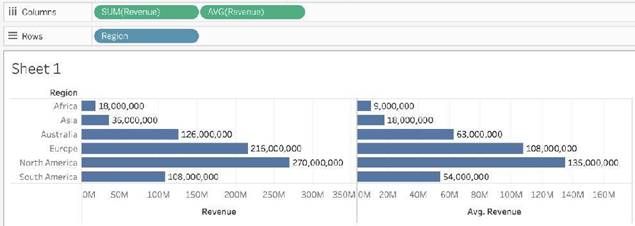
We are using BOTH theSum of the revenue and theAVG of the revenue in the same view!