Suppose you create a bar chart by dragging a dimension to the Column shelf and a measure to the Rows shelf. Which of the following would create a stacked bar chart?
Correct Answer:
C
Very important question for the exam and appears quite a lot too.
The correct answer is - By dragging another dimension to Color on the Marks card.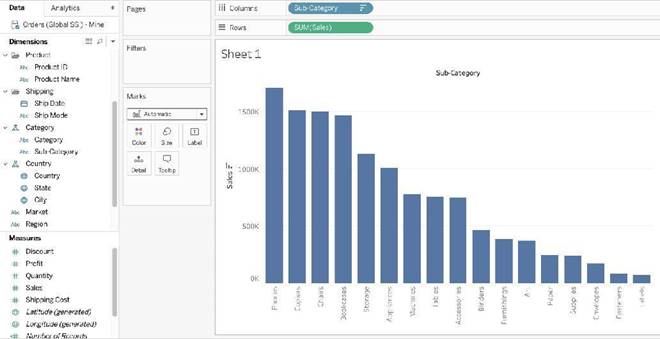
This is what the question says we have already created. Now to convert this into a Stacked bar chart, we will drop another dimension on Color in the Marks card.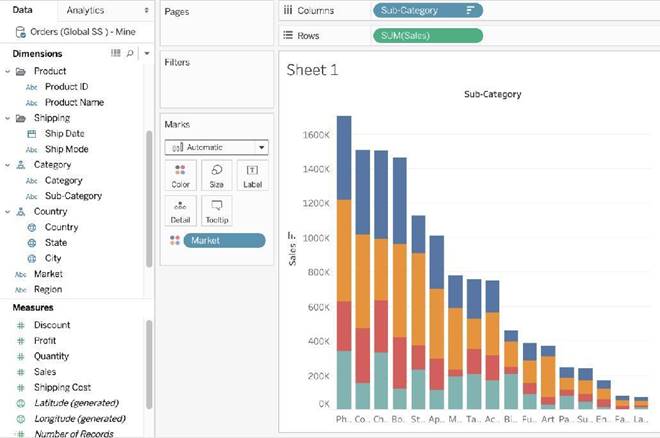
The rest won't create stacked bar charts, and hence are incorrect choices. The best way to answer such questions on the real exam is to quickly do what the options say and see if
they satisfy the requirements in the question.
Which chart type uses automatically generated sizes that cannot be resized by using the Marks card?
Correct Answer:
A
Treemaps use automatically generated sizes that cannot be resized by using the Marks card. A treemap is a type of visualization that shows hierarchical data as a set of nested rectangles. Each rectangle represents a dimension member and its size is proportional to a measure value. Tableau automatically calculates the size of each rectangle based on an optimal aspect ratio for readability and comparison. You cannot manually adjust the size of each rectangle by using the Marks card or any other option in Tableau10 The other chart types do not use automatically generated sizes that cannot be resized by using the Marks card. Pie charts use angles to show proportions of a whole, not sizes. Histograms use bins and frequencies to show distributions of a measure, not sizes. Area charts use filled areas to show trends over time or categories, not sizes. You can adjust the size of these chart types by using the Marks card or other options in Tableau
By default, measures placed in a view are aggregated. The type of aggregation applied _______
Correct Answer:
B
By default, measures placed in a view are aggregated. Mostly you'll notice that the aggregation is SUM, but not ALWAYS.
The type of aggregation applied varies depending on the context of the view. Reference: https://help.tableau.com/current/pro/desktop/en-
us/calculations_aggregation.htm
You can ______ your data to combine two or more tables by appending values (rows) from one table to another
Correct Answer:
D
You can union your data to combine two or more tables by appending values (rows) from one table to another. To union your data in Tableau data source, the tables must come from the same connection.
For example, suppose you have the following customer purchase information stored in three tables, separated by month. The table names are "May2016," "June2016," and "July2016."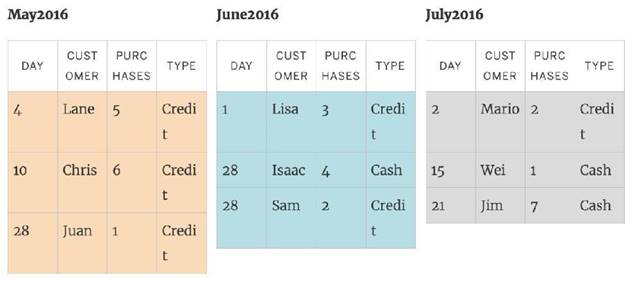
A union of these tables creates the following single table that contains all rows from all tables.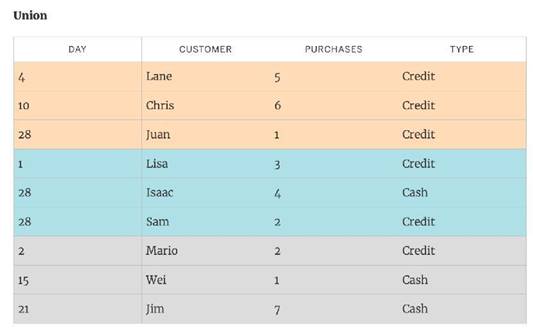
Reference: https://help.tableau.com/current/pro/desktop/en-us/union.htm
Dates in Tableau are typically treated as ______
Correct Answer:
A
For relational data sources, dates and times are automatically placed in the Dimensions area of the Data pane and are identified by the date or date-time icon. For example, the Order Date and Ship Date dimensions from an Excel data source are shown below: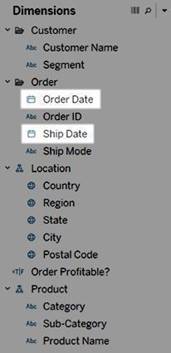
When you place a relational date on a shelf, the field name is automatically modified to reflect the default date level. Tableau defines the default date level to be the level at which there are multiple instances. For example, if the date field includes multiple years, the default level is year. However, if the date field contains data for just one year but includes multiple months, then the default level is month.
Reference: https://help.tableau.com/current/pro/desktop/en-us/dates.htm