Which statement accurately describes creating a group by selecting headers in a view?
Correct Answer:
C
When creating a group by selecting headers in a Tableau view, the newly created grouped dimension replaces the original dimension field on either the Rows or Columns shelf. This grouping action aggregates the selected headers into a single group, and this new group dimension is automatically placed in the view, replacing the original dimension. This functionality allows for more simplified and customized categorization within the data visualization, enhancing the ability to analyze and interpret data according to specific groupings.
Which two functionalities can you provide to consumers by adding a parameter to a visualization? Choose two.
Correct Answer:
AC
In Tableau, parameters are dynamic values that can replace a constant in calculations, filters, and reference lines. If you have a parameter controlling a calculation, changing the parameter value can change the results of that calculation, thus impacting the visualization. Parameters can also be used to switch between different fields in the visualization; for example, allowing users to choose which measure or dimension to display.
Skipped Join the Geo Data and Time Series Table on the Item Number ID column, and display the Store count for every State on a Map. What was the Store count in 2017 for Texas (TX)?
Join the Geo Data and Time Series Table on the Item Number ID column, and display the Store count for every State on a Map. What was the Store count in 2017 for Texas (TX)?
Correct Answer:
C
Since you need BOTH State and the YEAR, we need to use an Inner Join. Follow the steps below:
______ is a method for appending values (rows) to tables. You can use this method if both tables have the same columns. The result is a virtual table that has the same columns but extends vertically by adding rows of data.
Correct Answer:
D
Unioning is the correct answer! From the official documentation: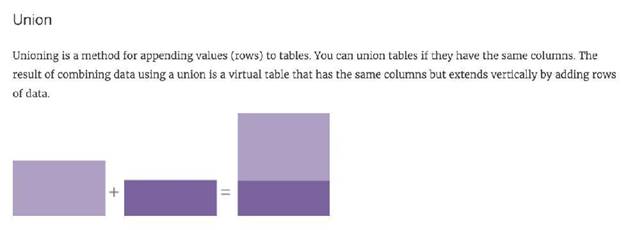
For example, suppose you have the following customer purchase information stored in three tables, separated by month. The table names are "May2016" , "June2016" and "July2016."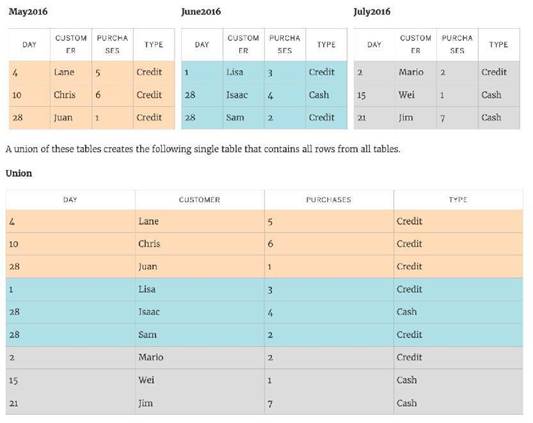
Reference: https://help.tableau.com/current/pro/desktop/en-us/union.htm
Relationships are represented by _______ and operate at the ________.
Correct Answer:
A
From the official documentation:
The default view that you first see in the Data Source page canvas is the logical layer of the data source. You combine data in the logical layer using relationships (or noodles).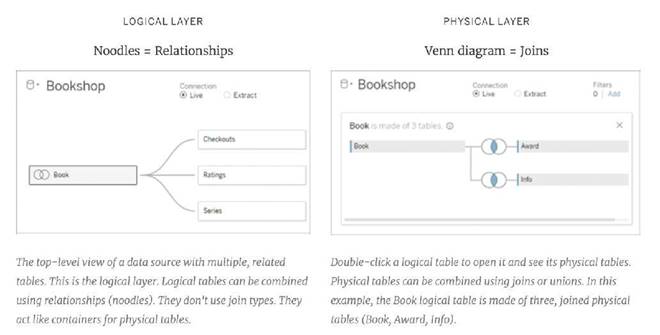
Reference: https://help.tableau.com/current/server/en-us/datasource_datamodel.htm